01 / contextGive evidence a name and a source
Adapters and conviction builders represent regime, positioning, orderflow, calendar, and historical context as inspectable inputs.
Convex · source adaptersMake conviction inspectable.

The public face of Meridian leads with auditable reasoning, explicit gates, and operator control. Its private-desk positioning frames the research prototype.
I designed and built Meridian around a question that gets lost in a busy trading desk: what, exactly, supports this decision? The research prototype connects a ranked signal, its contributing evidence, and a structured review path. It explores the interface and engineering of judgment; its demo values are not a trading record.
The consequential problem
A trader moves between price structure, market regime, positioning, events, and risk. Compressing those inputs into a ranked list is useful for scanning, but the ranking alone cannot explain which inputs agreed, which conflicted, or what should stop the next step.
Meridian needed to stay calm enough to scan while retaining enough structure to interrogate a single idea. The design problem was connecting those two levels of attention.
What I saw
I treated the score as an entry point into evidence. A conviction stack shows each source, score, weight, and contribution. A connected decision graph then puts those inputs into a sequence: trigger, confirmation, validation, context, and execution. Selecting a node can lead back to the evidence that contributed to it.
The decision that changed the system
The interface moves from Pulse to a signal, deeper analysis, and a structured plan. Tabs, signal identity, and analysis state live in the URL, making a particular view addressable and recoverable. Configurable conviction weights expose the calculation instead of making the ranking feel untouchable. A separate paper-only engineering iteration adds evidence checks before any broker-paper dispatch can become eligible.
A compact signal card brings direction, conviction, risk, and plan context into the first read.
Open the conviction stack and follow a decision node back to its contributing evidence.
Keep entry, stop, target, and size explicit before a consequential next step.
Signal and order references connect the operating model to searchable memory and review.
System anatomy / rationale / surfaces
The implemented application uses a JavaScript web stack and Convex domain models. The research and paper-safety work remain distinct from a validated strategy or a production trading operation.
A ranked signal can look decisive while hiding the contribution of each input.
Show a weighted conviction stack with source-level scores, weights, and contributions; make local weights configurable.
The ranking becomes an inspectable research model rather than a claim of certainty.
Adapters and conviction builders represent regime, positioning, orderflow, calendar, and historical context as inspectable inputs.
Convex · source adaptersWeighted conviction, individual contributions, and linked decision nodes make the ranking open to inspection.
JavaScript scoring · decision graphAddressable views connect desk scanning, signal detail, analysis, and plan fields across desktop and mobile layouts.
Next.js · React · Lightweight ChartsA local paper-safety branch checks strategy-bound evidence, account identity, and broker acknowledgements. Live execution is explicitly disabled in that branch.
Node.js · IBKR adapter · evidence gatesA researcher can inspect the calculation and see what the number depends on.
Moving between summary and detail preserves a recoverable review context.
Interface completeness cannot silently become authority to dispatch.
The system becomes tangible through the places people encounter and use it.
A compact first read of candidates, directional context, and conviction.
Source-level conviction, concerns, and connected decision paths.
Structured plan fields alongside separate approval, order, and memory surfaces.
Local journals and runtime checks that keep demo, paper readiness, and live authority distinct.
Next.js · React · Tailwind CSS · Framer Motion
Lightweight Charts · decision graphs · weighted conviction
Convex · PostgreSQL / TimescaleDB · Node.js · IBKR integration
Select a tool to see the role it plays in this system.
The public introduction and research application share a web delivery framework and route structure.
Authentic proof
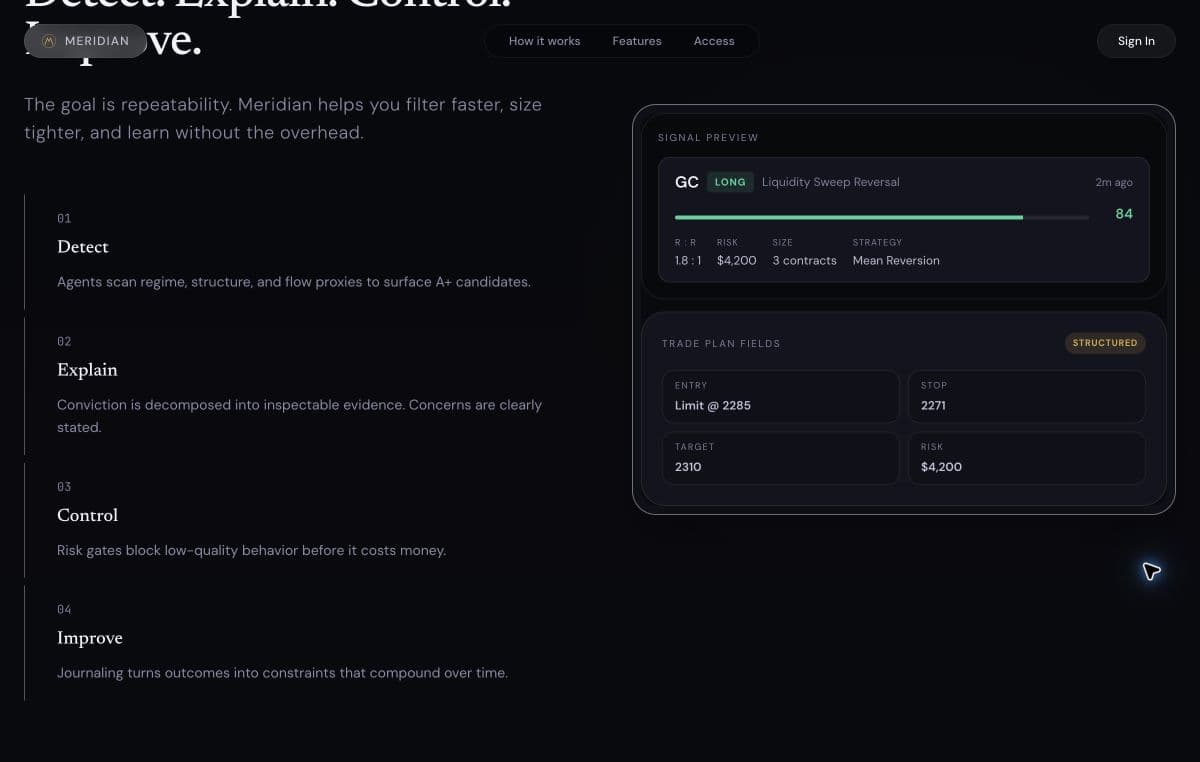
The existing public preview places the signal and its plan fields together. The displayed scores, prices, size, and risk are illustrative demo values, not execution or performance evidence.
What changed in my operating model
Meridian taught me to design the path for scrutiny as carefully as the first impression. A clean chart or confident score can help someone orient, but the product earns a second look when the inputs, disagreements, and stopping conditions remain available.
The work remains a research prototype. The lasting design lesson is that better presentation should make uncertainty easier to examine, and never turn a demo into an implied claim about real-world outcomes.